Mifflin-St Jeor vs. Katch-McArdle: Which BMR Formula Is Actually Right for You?
Most weight loss plateaus trace back to the wrong baseline number. See how Mifflin-St Jeor and Katch-McArdle compare by body type, plus a real worked example of how a bad body fat reading breaks a deficit.

Most weight loss plateaus do not come from a lack of discipline. They come from starting with the wrong baseline number. If your calculated maintenance calories are 200 too high, your "500 calorie deficit" is really a 300 calorie deficit, and the scale reflects that within a month.
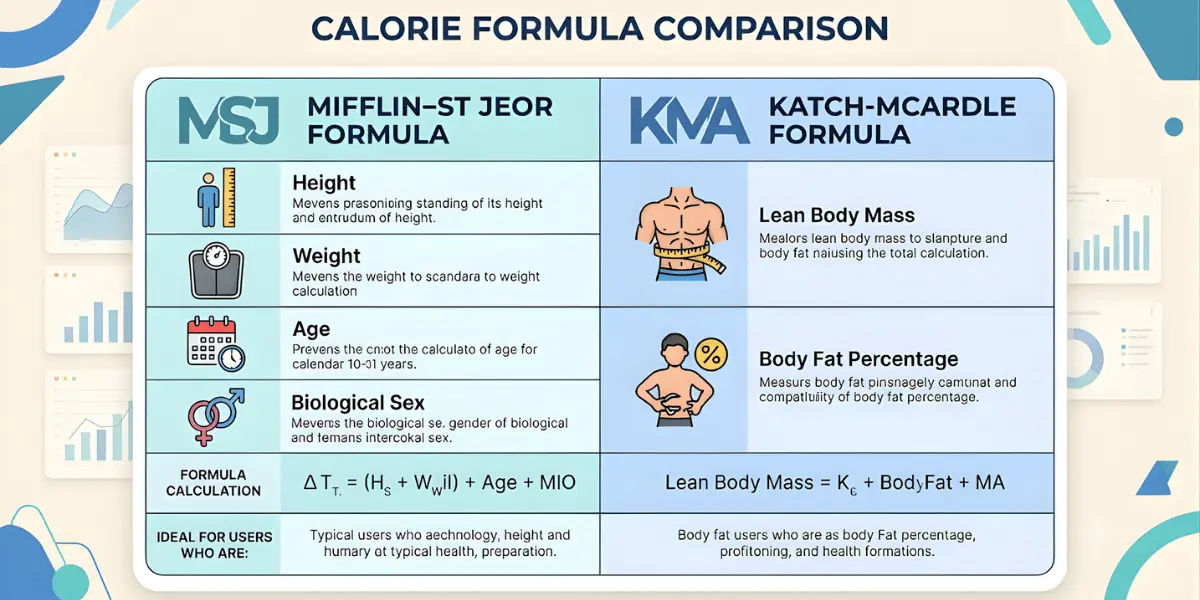
The two formulas most people end up choosing between are Mifflin-St Jeor and Katch-McArdle. They answer the same question using completely different information, and that difference matters more for some bodies than others.
| Mifflin-St Jeor | Katch-McArdle | |
|---|---|---|
| Inputs | Height, weight, age, biological sex | Lean body mass only |
| Core assumption | All body weight is treated the same | Only fat-free mass burns baseline energy |
| Most accurate for | General population, unknown body fat % | Lean athletes with a verified body fat reading |
| Requires testing | No | Yes, a reliable body fat measurement |
The Science Behind Both Formulas
Mifflin-St Jeor (1990)
The equations are straightforward:
Men (metric): BMR = (10 × weight in kg) + (6.25 × height in cm) − (5 × age) + 5 Women (metric): BMR = (10 × weight in kg) + (6.25 × height in cm) − (5 × age) − 161
Men (US units): BMR = (4.536 × weight in lbs) + (15.88 × height in inches) − (5 × age) + 5 Women (US units): BMR = (4.536 × weight in lbs) + (15.88 × height in inches) − (5 × age) − 161
Clinical guidelines, including those referenced by the Academy of Nutrition and Dietetics, default to Mifflin-St Jeor for resting energy estimates in adults.
The reason is practical rather than theoretical. When a DEXA scan is not available, and it usually isn't, Mifflin-St Jeor produces the smallest average error across a broad population using four inputs anyone can measure at home.
Katch-McArdle (and the Cunningham variant)
Katch-McArdle throws out height, age, and sex entirely:
BMR = 370 + (21.6 × lean body mass in kg)
Lean body mass is simply total weight minus fat weight. A 90 kg man at 18% body fat carries 73.8 kg of lean mass.
The Cunningham equation is a close cousin used more often with athletes:
BMR = 500 + (22 × lean body mass in kg)
It runs slightly higher, which is why many coaches prefer it for heavily trained clients.
The reason these formulas ignore age and sex is that they are already accounted for indirectly. A 55 year old woman and a 25 year old man with the same lean body mass have similar resting energy needs, because muscle and organ tissue metabolize energy at roughly the same rate regardless of who is carrying it.
Age and sex matter in Mifflin-St Jeor only because they act as proxies for how much lean mass a person probably has.
Accuracy Across Different Body Types
This is where the "which one is better" question gets a real answer instead of a generic one.
Scenario A: Average build, untrained
Body fat around 18% to 28%. Someone who walks, works a normal job, and lifts occasionally or not at all.
Here the two formulas land in almost the same place, usually within 50 to 100 kcal of each other. Mifflin-St Jeor was built on exactly this population, so its assumptions hold. Katch-McArdle adds no useful precision, and since it requires a body fat number that most people are guessing at, it often adds error instead.
Verdict: Use Mifflin-St Jeor. The extra step buys you nothing.
Scenario B: Lean and muscular
Under roughly 15% body fat for men, under 22% for women.
Mifflin-St Jeor consistently underestimates BMR in this group, often by 5% to 10%. The formula sees total weight and assumes an average amount of that weight is fat.
For a lifter carrying 8 kg more muscle than average, that assumption quietly penalizes them for being lean, and the result is a maintenance number that feels too low in practice.
Katch-McArdle handles this correctly because lean mass is the only input. It credits the muscle directly instead of averaging it away.
Verdict: Use Katch-McArdle, provided the body fat number is from a DEXA, BodPod, or skilled caliper reading.
Scenario C: High BMI or obesity
Above 25% body fat for men, above 32% for women.
Two separate problems show up here.
The first is over-estimation. Mifflin-St Jeor scales BMR with total body weight, and fat tissue burns far less energy per kilogram than muscle does.
At high body weights the formula can inflate maintenance calories, which means someone eating exactly at their "deficit" target is closer to maintenance than they think.
The second is the smart scale problem. Bioimpedance scales are the most common way people get a body fat reading, and they are least reliable at higher body fat percentages and at the extremes generally.
Hydration status alone can swing a reading by several percent between morning and evening. Feeding a bad body fat number into Katch-McArdle produces a confident, precise, wrong answer, which is worse than a rough one.
Verdict: Use Mifflin-St Jeor, but treat the output as a ceiling rather than a target. Start with a modest deficit of 15% to 20% below the calculated TDEE and adjust from real weight trends rather than trying to out-calculate the formula.
The Math of Error: How a 5% Body Fat Mistake Breaks Your Deficit
This is worth walking through with real numbers, because it explains why "more precise formula" does not always mean "better result."
Take a 95 kg man, moderately active.
His smart scale says 25% body fat. His actual body fat, measured by DEXA, is 20%.
| Scale reading (25% BF) | Real (20% BF) | |
|---|---|---|
| Lean body mass | 71.25 kg | 76 kg |
| Katch-McArdle BMR | 1,909 kcal | 2,012 kcal |
| TDEE at 1.55 multiplier | 2,959 kcal | 3,119 kcal |
The gap is about 160 kcal per day. Over 30 days that is roughly 4,800 kcal, close to 1.4 lbs of body fat.
Put differently: if he intended a 500 kcal daily deficit, he expected about 4.3 lbs of loss in a month. The measurement error eats nearly a third of it.
He sees 3 lbs instead of 4.3, assumes his metabolism is broken, and cuts calories further when the real fix was a better body fat reading or a simpler formula.
Running the same man through Mifflin-St Jeor, assuming 178 cm and age 32, gives a BMR of 2,077 kcal. Notice that this sits closer to his true Katch-McArdle value than his scale-derived one did. A formula with no body fat input beat a formula with a bad body fat input.
Activity Multipliers and Metabolic Adaptation
Formula choice is rarely the largest source of error. The activity multiplier is.
The range from sedentary (1.2) to extra active (1.9) can swing daily calories by 1,000 or more on the same BMR. Most people select one tier higher than their real life justifies, because a few gym sessions a week feels like "very active" when it usually isn't. A single tier of inflation, say 1.55 instead of 1.375, adds around 300 kcal to a typical TDEE. That alone can cancel a deficit.
There is also what happens after several weeks of eating less. Around the 6 to 8 week mark in a sustained deficit, non-exercise activity thermogenesis tends to drop.
People fidget less, walk a little slower, take the stairs a little less often, all without noticing. Your formula still says 2,900 kcal, but your body may now be spending closer to 2,650. No equation predicts this, because it is a behavioral response, not a mathematical one.
The fix is not switching formulas. It is calibration.
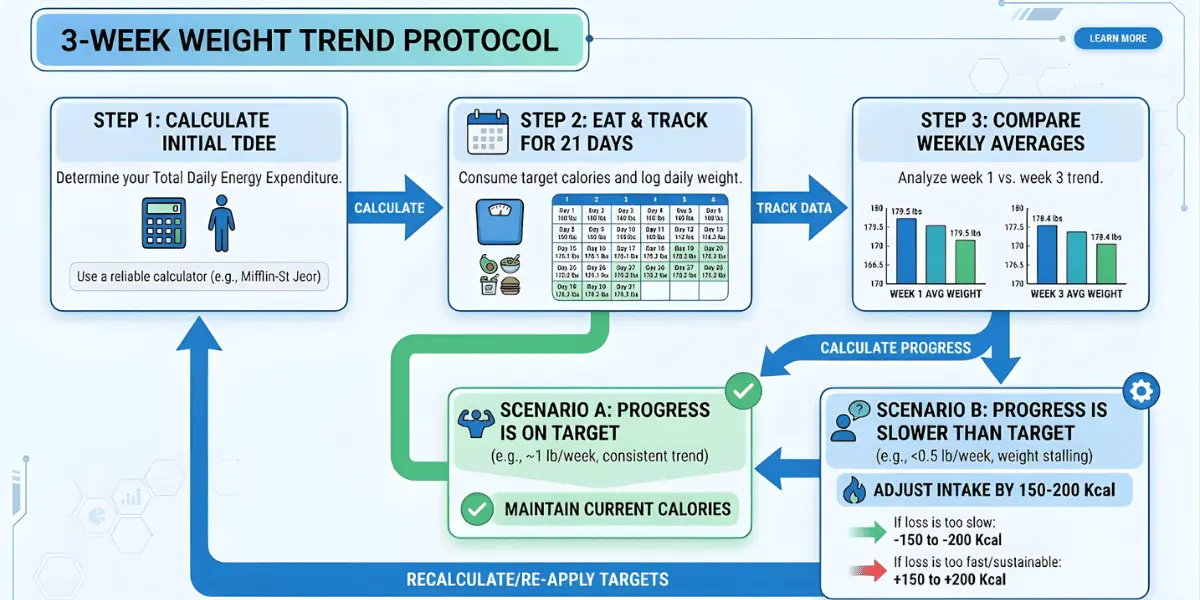
The 3 week trend protocol:
- Calculate TDEE with whichever formula matches your body type.
- Eat at that number, or at your intended deficit, for 21 days without changing anything.
- Weigh daily under the same conditions and use the weekly average, not single readings.
- Compare week 1 average to week 3 average. Roughly 0.5 kg lost per week means a deficit near 550 kcal is actually happening. No change means you are at maintenance, whatever the calculator said.
- Adjust intake by 150 to 200 kcal based on that result and repeat.
After one cycle you have a number grounded in your own data. That number beats any formula, including the one you started with.
Decision Matrix
| Your situation | Use this |
|---|---|
| No DEXA, BodPod, or caliper reading | Mifflin-St Jeor |
| Smart scale is your only body fat source | Mifflin-St Jeor |
| Recent DEXA or BodPod, under 15% BF (men) or 22% (women) | Katch-McArdle |
| Trained athlete with verified lean mass | Cunningham variant |
| More than 20 lbs to lose | Mifflin-St Jeor with a 15% to 20% deficit |
| Plateaued for 3+ weeks on an accurate log | Neither, recalibrate from weight trend data |
Run Both and Compare
The fastest way to see how much your formula choice actually changes things is to calculate both side by side. If the two numbers land within 100 kcal of each other, the question is settled and you can stop thinking about it. If they diverge by 200 or more, that gap tells you something about your body composition worth knowing.
Use the Mifflin-St Jeor Calculator to get your baseline, then run the Katch-McArdle comparison with your body fat percentage to see both results together.
Pick the formula that fits your body, then stop trusting it after three weeks and start trusting your own scale trend instead. That is the part that actually moves the number.
Written by
Contributor at BMR·Lab, covering the science of human energy expenditure and evidence-based nutrition.
Related reading
All articles Fundamentals
Mifflin-St Jeor for Older Adults: How Accurate Is It After Age 60?
Metabolism shifts after 60 — sarcopenia, hormones, and organ changes all move the number. Here's how Mifflin-St Jeor holds up for seniors, where it falls short, and how to set safe targets.
 Fundamentals
Mifflin-St Jeor for Athletes: How Accurate Is It for Active People?
Athletes carry more lean mass than the average person Mifflin-St Jeor was built on — so how far off does the formula run? Here's the real underestimation range, and how to adjust for it.
 Fundamentals
How Accurate Are Fitness Trackers for Calories Burned? (And What to Do Instead)
A hard workout says 612 calories burned on your watch. The heart rate is probably right — the calorie number almost certainly isn't. Here's why wearables miss by 20-90%, and what to track instead.